Your GPU Is Not Slow, It Is Waiting for Memory
Inference behaves like two workloads with opposite requirements, sharing the same silicon. Once you see that, the strange utilisation numbers start making sense.
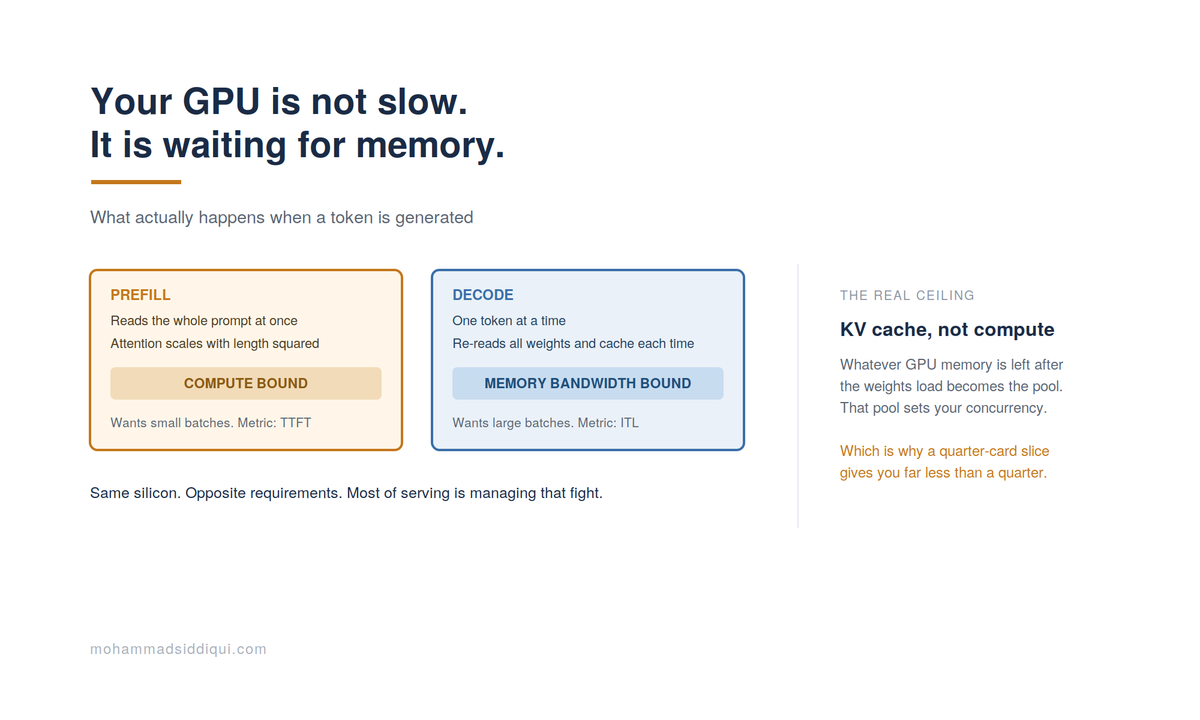
Most infrastructure people I talk to about AI are reasoning about it the way we reason about any other workload. Allocate the GPU, size the memory, watch utilisation, add capacity when it fills up.
That model breaks almost immediately, and the reason is worth understanding properly rather than working around. Inference doesn't behave like one workload. It behaves like two, with opposite characteristics, sharing the same silicon and fighting each other for it.
Once you see that, a lot of things that look strange start making sense. Why a GPU reports 35% utilisation while refusing more requests. Why doubling batch size sometimes doubles throughput and sometimes destroys latency. Why the fractional GPU slice you carved up so neatly performs worse than the arithmetic suggested.
This is the layer above the hypervisor, and it's where I think infrastructure architects need to get to. None of it is VMware-specific, which is rather the point: the mechanics are the same whether you're running vLLM on VCF, on OpenShift, or on bare metal in someone else's data centre.
Two phases, pulling in opposite directions
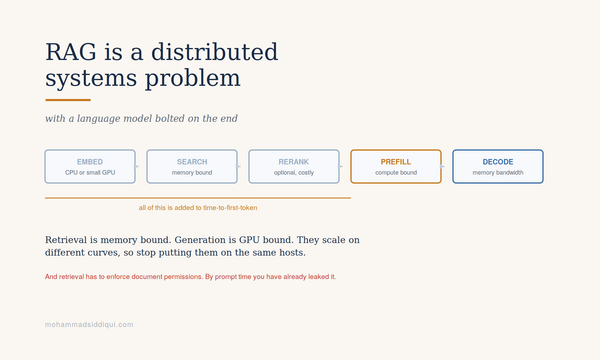
When a request arrives, the model does two quite different jobs.
Prefill: reading the prompt
Decode: writing the answer
Those two phases want opposite things from the scheduler. Prefill wants small batches so it doesn't blow out latency for everyone. Decode wants large batches, because if you're reading the weights out of memory anyway, you may as well amortise that read across as many sequences as possible.
Serving systems spend most of their effort managing that tension.
The KV cache, and why it's the real capacity limit
To avoid recomputing attention over the whole sequence at every step, the model caches the key and value tensors it has already computed. That's the KV cache, and it's the central data structure in the whole business.
It grows with sequence length and with the number of concurrent requests. Roughly:
# the 2 is keys and values. Grouped-query attention reduces kv_heads,
# which is why it changes your concurrency ceiling as much as it does.
Here's the consequence. After the model weights load, whatever GPU memory is left becomes the KV cache pool, and that pool is what decides how many requests you can hold in flight. Not compute. Memory.
Which means a GPU can be nowhere near compute-saturated and still refuse work, because it's out of somewhere to put the context. If you've seen a GPU sitting at modest utilisation while queueing requests, that's usually what you're looking at.
What PagedAttention fixed
Early serving systems allocated the KV cache as one contiguous block per sequence, sized for the longest output that request might produce. A request that finished after 200 tokens held memory reserved for thousands.
Published figures put the waste in those systems somewhere between 60 and 80 percent of KV cache memory.
vLLM borrowed virtual memory from operating systems. The cache is split into fixed-size blocks, a per-sequence block table maps logical token positions to physical blocks, and the blocks don't need to be contiguous. Waste drops to under 4 percent.
Why this matters to you specifically
Continuous batching, and the collision it creates
Static batching waits for a batch to fill, runs it, waits for the slowest request to finish, then starts again. The GPU idles while short requests sit finished alongside long ones.
Continuous batching schedules per iteration rather than per request. Finished sequences leave the batch, new ones join, every forward pass is full. Reported gains are in the region of two to three times the throughput of static batching.
But it creates a problem of its own. When a new request is admitted, its prefill is a big compute-bound operation that has to share a forward pass with everyone else's decode steps. One long prompt arriving can stall every token being generated for every other user.
Chunked prefill, the fix for that
Preemption, which you should know happens
Now the infrastructure part
This is where it connects to the decisions you and I actually make.
GPU selection: bandwidth over FLOPS, usually
Fractional GPU slices cut your KV pool, not just your compute
MIG versus time-slicing is a QoS decision
Why multi-tenancy improves utilisation, mechanically
Interconnect matters once a model stops fitting
CPU topology still matters, which surprises people
Memory tiering won't save you here
Diagnosing a slow deployment
Three failure modes, and they want different fixes. This is the most practically useful thing in the whole piece.
If you take one operational habit from this: before anyone approves GPU spend, find out which of those three you're in. I'd guess most organisations have never checked.
Where this is heading
Two things worth watching, because they'll change how you design for this.
Disaggregated prefill and decode. Since the two phases want opposite hardware characteristics, run them on separate pools and ship the KV cache between them. Different instance types for different phases of the same request. It's an active area and it would reshape how you'd lay out a GPU estate.
KV cache as shared infrastructure. Caches that live outside a single serving instance, so a prefix computed on one node can be reused on another. That turns KV cache from a per-instance memory concern into something closer to a storage tier, with the naming, eviction and consistency problems that implies. Which is familiar territory for anyone who has designed a cache before.
None of this is VMware-specific
Everything above comes from how transformer inference works and how modern serving systems manage memory. It applies the same whether you're running vLLM under VCF, under OpenShift AI, under Ray, or on a bare metal box in a cupboard.
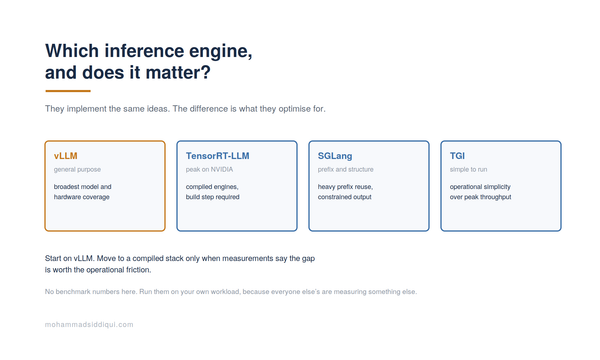
vLLM has become the common substrate across a lot of platforms, which is genuinely useful for us, because the tuning knowledge transfers. The alternatives are worth knowing too: TensorRT-LLM tends to win on NVIDIA hardware specifically, and SGLang and TGI have their own tradeoffs around memory efficiency and scheduling.
Where the platform does matter is everything underneath: how the GPU is presented, how tenants are isolated, what the fabric looks like, whether the CPU topology is working with you or against you. That's the layer I know best, and it's the one that decides whether the serving stack above it ever gets a chance to perform.
Things to go and check
Sources
- Efficient Memory Management for Large Language Model Serving with PagedAttention, Kwon et al. The original paper, and still the clearest explanation of the block-based approach.
- Inside vLLM: anatomy of a high-throughput inference system: the prefill and decode split, preemption behaviour, and the connector abstraction for distributed KV.
- vLLM documentation: the configuration surface, including memory utilisation and chunked prefill.
- Optimizing AI Deployments with VCF, Part 1, Broadcom: the multi-tenant GPU utilisation figures.
- VCF on Supermicro HGX reference architecture: the fabric design and RoCEv2 choice.
- VCF and NVIDIA Hypervisor Certification.
Serving systems move quickly and specific flags and defaults change between releases. The mechanics are stable, the tuning surface is not. Check the documentation for whatever version you're actually running.
Views expressed here are my own.